BAC Levels Chart – What Different Blood Alcohol Percentages Mean
Blood Alcohol Content (BAC) levels are used worldwide to describe how alcohol affects the body at different concentrations. As BAC increases, physical coordination, judgment, and reaction time become increasingly impaired. Understanding these levels can help people recognize signs of intoxication and make safer decisions related to alcohol consumption.
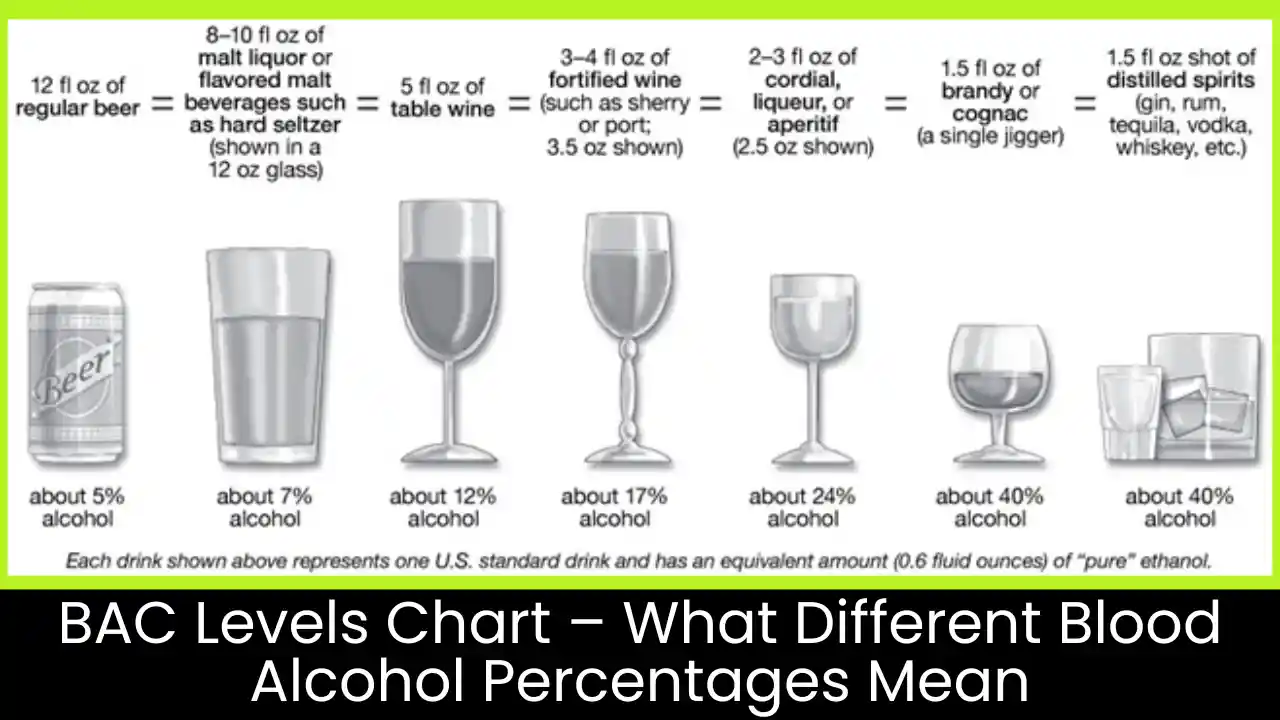
This BAC levels chart explains common blood alcohol percentages and their general effects. The information is intended for educational and awareness purposes only and does not replace professional testing or legal evaluation. Individual responses to alcohol vary depending on body weight, metabolism, drinking speed, and other personal factors.
BAC Levels and Their Effects
0.01% – 0.03%
- Mild relaxation
- Slight changes in mood
- Minimal impairment
0.04% – 0.07%
- Reduced judgment
- Lower coordination
- Slower reaction time
0.08% – 0.14%
- Legal impairment in many countries
- Poor muscle control
- Difficulty concentrating
0.15% – 0.24%
- Severe impairment
- Loss of balance
- Nausea or vomiting possible
0.25% and above
- Serious health risks
- Risk of unconsciousness
- Potentially life-threatening effects
Why BAC Levels Matter
Knowing BAC levels helps individuals understand how alcohol consumption may affect their ability to think clearly and act safely. Even moderate BAC levels can impair decision-making and coordination, increasing the risk of accidents and injuries.
BAC charts are commonly used for educational purposes to raise awareness about responsible drinking. They are not designed to determine legal fitness to drive or replace professional alcohol testing methods.
BAC Levels and Driving Safety
Many countries enforce strict BAC limits for driving, with 0.08% being a common legal threshold. However, some regions apply lower limits or zero-tolerance policies for certain drivers. Even below legal limits, alcohol can still reduce reaction time and attention, making driving unsafe.
Always follow local laws and choose safe alternatives if alcohol has been consumed.
BAC Levels Chart vs BAC Calculator
A BAC chart provides a general overview of how different BAC percentages affect the body, while a BAC calculator estimates your personal BAC based on specific inputs such as weight, drinks consumed, and time. Both tools are intended for educational use and should not be used for legal or medical decisions.
“You can estimate your personal BAC using our BAC Calculator for a more customized result.”

Final Thoughts
Understanding BAC levels is an important step toward making safer and more informed decisions about alcohol consumption. A BAC levels chart helps explain how different blood alcohol percentages generally affect the body, but it should always be viewed as an educational reference rather than a precise measurement. Individual responses to alcohol can vary widely depending on personal factors such as metabolism, body composition, and drinking habits.
While charts provide helpful awareness, they cannot replace professional testing or legal standards. Even low BAC levels may reduce reaction time and judgment, increasing safety risks. The safest choice is always to avoid driving or performing risky activities after drinking. This guide is designed to support responsible decision-making and should be used alongside common sense and local laws.
FAQs: Frequently Asked Questions
What does BAC stand for?
BAC stands for Blood Alcohol Content, which measures the amount of alcohol present in the bloodstream as a percentage.
At what BAC level do you feel drunk?
Feelings of intoxication can begin at low BAC levels, often below 0.05%, depending on the individual and drinking conditions.
Is 0.08% BAC considered drunk?
In many countries, a BAC of 0.08% is legally considered impaired for driving, even if a person does not feel drunk.
Can BAC levels vary for the same number of drinks?
Yes. BAC levels can vary based on body weight, gender, drinking speed, food intake, and metabolism.
Is a BAC chart better than a BAC calculator?
A BAC chart shows general effects, while a BAC calculator provides a more personalized estimate based on specific inputs. Both are for educational use only.
Disclaimer
This content is provided for educational purposes only and should not be used for medical, legal, or driving decisions.